OMAFRA specialists are a dedicated group of public servants motivated to improve the lives and economic outcomes of Ontario growers and provide the highest value to Ontario taxpayers by providing the best service and recommendations based on the latest understanding of agronomic principles.
Interview Methodology
Our specialist interviews were conducted typically over 1-1.5 hour sessions and were designed to help our team identify the data lifecycle of a key dataset that our specialists collected and analysed.
Through our interviews we sought to define the lifecycle of the data the specialists work with. At the time of our interviews the lifecycle was defined as 5 phases: Collection, Reporting, Aggregation, Analysis, and Output. We asked four questions for each section: Who, What, Why, and How.

In the time since the initial interviews were conducted we revised our data lifecycle model, renaming the original version the Data Roadmap and defining the new Data Lifecycle with four sections: Store, Collect, Analyse, and Share.

You can read more about the flaws identified in the original diagram and developing the new diagram in this document: Defining Data: Roadmap vs Lifecycle
Document Overview
This document summarises interviews with 6 groups of OMAFRA specialists and a number of informal discovery conversations. The focus of the interviews was to identify representative data lifecycles across the ministry and identify current tools and processes used in the collection and analysis of data as well as to define challenges faced by staff and opportunities for improvement within this scope.
This document covers interviews conducted covering the following datasets:
- Vegetable Pest and Pathogen Monitoring
- Herbicide Resistance Trials
- Pest Sightings
- Fireblight Prediction
- Field Crop Trials
- AICC call-ins
Research Insights
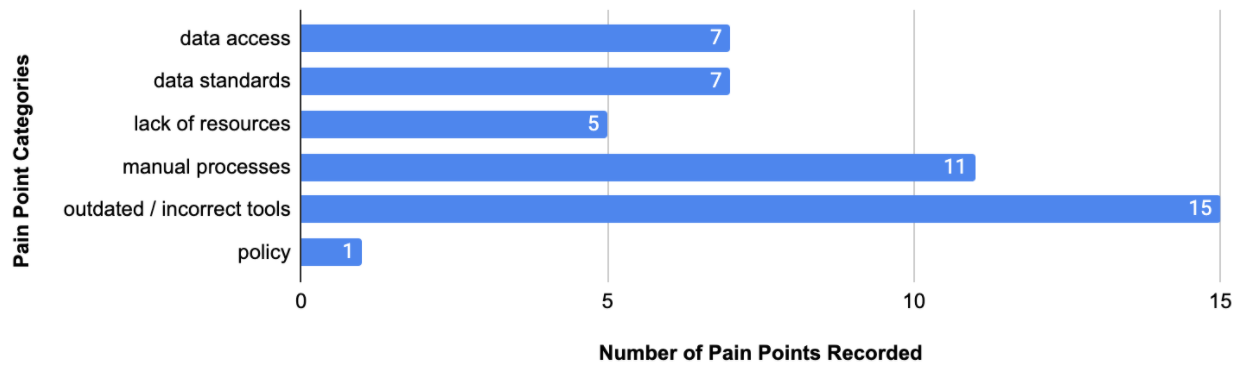
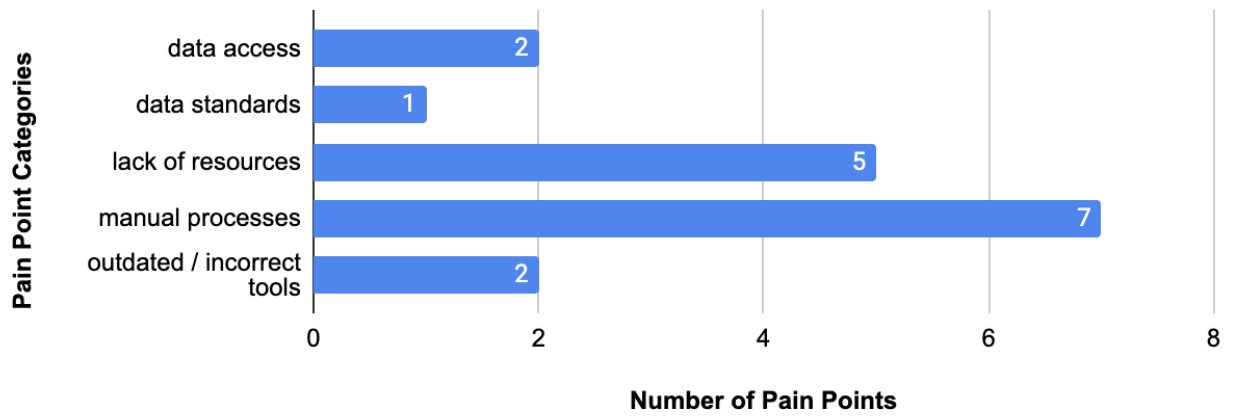
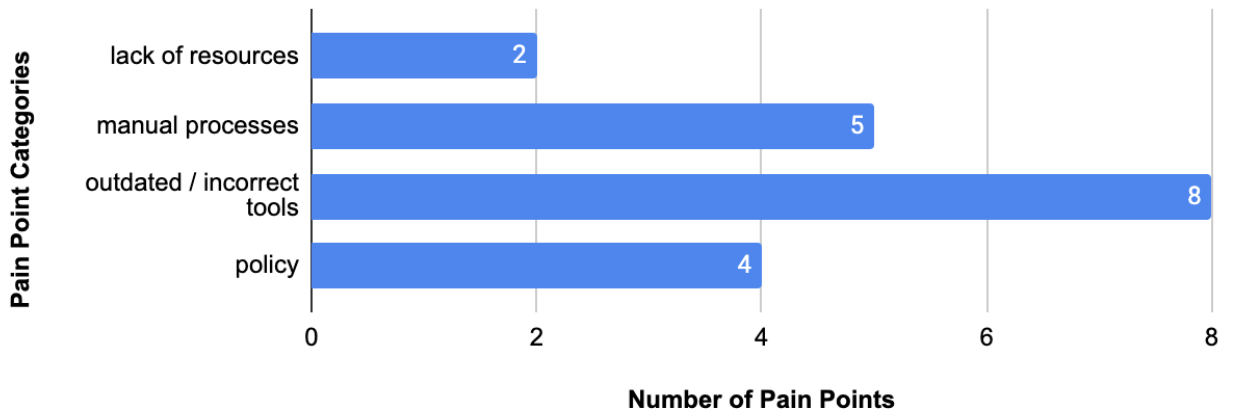
A few themes appear in the course of this analysis. Below is a broad breakdown of the different categories of pain points discovered during the specialist interviews.
![Number of pain points by category and phase. Format = Category: [Collect total, Analyse total, Share total]. Outdated/Incorrect Tools: [15, 2, 8], Manual Proceses: [11, 7, 5], Lack of Resources: [5, 5, 2], Data Access: [7, 2, 0], Data Standards: [7, 1, 0], Policy: [1, 0, 4]](/omafra-updates/images/pain_points_graph_all.png)
Below, the pain points in different phases — collect, analyse, and share — are examined in more detail.
Collect
Data Access
Two key datasets — external weather data and internal historical data — come up in nearly every conversation with specialists. While access to these datasets does exist it is often difficult to determine the quality and often large gaps exist that make the value of the data questionable.
Data Standards
Consistency in data quality, even across a single dataset, can pose major challenges. Specialists identify inconsistent data standards and challenges in the collection of data as significant roadblocks to their work.
Lack of Resources & Outdated or Incorrect Tools
An oversized amount of time is spent collecting data personally which can leave inadequate time for other phases of the project. Especially with larger projects insufficient staff hours make this difficult. Staff collecting data also often have to use tools such as pen and paper for collection or email as a filing system that increase the time spent managing data.
Manual Processes
Manual data entry and recording are a major component of the time spent collecting data. Digitizing pen & paper notes or manually transferring data from one format to another was identified as a challenge by nearly every specialist interviewed.
Policy
Specialists face uncertainty when collecting personally identifiable information. Unclear definitions and processes contribute to that uncertainty and can discourage specialists from collecting or sharing data.
Analyse
Data Access
Specialists identified a difficulty in accessing data relating to occurrences of events to validate prediction models. This can be broadened to an inability to compare multiple datasets when analysing data.
Data Standards
Data that is available to specialists can be in varying formats and not lend context to the data being analysed.
Lack of Resources
The computers that specialists use are often a barrier to work, either not being able to run necessary software or simply taking too long to boot up or perform simple tasks. This impacts specialists’ ability to analyse collected data and offer recommendations or support to growers.
Manual Processes
Many of the processes involved in analysis are manual tasks that must be repeated over and over again for different datasets or projects. Some specialists also face the need to manually confirm data points.
Outdated or Incorrect Tools
Many of the tools used to share data do not produce human readable outputs or give the ability to track changes over time. This fundamentally impacts the ability of specialists to utilize external data.
Share
Lack of Resources
Specialists identified a lack of resources available to update existing resources including publications and software tools.
Manual Processes
A large number of 1-on-1 communications with growers was also flagged as a challenge faced. This fundamentally stems from other challenges in publishing and shows that growers do not have adequate access to resources to answer their own questions.
Outdated or Incorrect Tools
When seeking to publish data or resources specialists face many barriers. Two common barriers are a lack of an accessible platform for specialists to publish on and an inability to share real-time information.
Policy
Public facing publications are subject to a number of regulations that specialists struggle to comply with. Primary among these are AODA and french translation policies. Specialists understand the importance of these regulations but lack the resources and support to comply while delivering high quality and timely information.
Interview Breakdowns
Below is a more in-depth breakdown of a sample of the datasets and processes covered in the specialist interviews conducted. Each section expands on what is being done for each phase — collect, analyse, and share — as well as how data is stored and the pain points experienced for each phase.
Vegetable Pest & Pathogen Monitoring
Crop specialists from OMAFRA scout and record pests and pathogens impacting Ontario vegetable growers. This is primarily done through in-field scouting using a variety of scouting report formats both analog and digital. This data is then analysed to identify risks and trends and findings are published online as well as in regular newsletters.
View the Vegetable Pest & Pathogen Monitoring Data Lifecycle diagram
Store
Vegetable pest and pathogen monitoring data is largely stored in Microsoft Excel. Data is manually added to spreadsheets, copy & pasted, or imported as a .csv. To access data sheets are opened in Excel or exported as a .csv.
Collect
Crop specialists and summer students collect data from a number of sources for the purpose of understanding pest & pathogen levels and spread.
Pest & pathogen scouting data includes the number of pests or plants affected, the date and location of collection, and ad hoc observations. This data is collected through in-field scouting with scouting reports (paper or pdf depending on crop). Reports are then digitized and observations are recorded through dictation, all of which is emailed to the specialist to be added to existing data platforms.
Weather station data from 2 stations owned by OMAFRA that include leaf wetness sensors can be downloaded as a .csv from a web interface and imported to prediction models in Excel.
Environment Canada weather data is manually copied from the web and recorded in Excel.
Pain Points
-
Data Access: Access to external weather data and internal historical data is inconsistent and involves a lot of manual work, making analysing larger trends difficult.
-
Data Standards: A lack of standardized data collection can make comparing different datasets difficult.
-
Lack of Resources: A lack of staff hours makes large projects difficult and impacts the ability of crop specialists to make adequate use of collected data. A need for manual scouting limits time even further.
-
Manual Processes: Lots of processes within data collection are manual that would ideally be automated. From digitizing analog reports, entering data, or cleaning externally collected data.
-
Outdated or Incorrect Tools: A number of the tools used by crop specialists are outdated or not well suited to the task. These include analog scouting reports, the process of recording informal observations, and the need to email digitized reports and notes to oneself to save them among others.
Analyse
Crop specialists analyse the collected data to identify immediate risks and long-term trends. Using GIS software for mapping and Microsoft Excel for prediction models, calculations, and graphing specialists create pest & pathogen threshold calculations, growing degree day estimates, and identify overall patterns.
Pain Points
- Manual Processes: Challenges in analysis revolve around the need for manual processes. While some calculations have been partially automated data must be manually entered or moved to the sheet with the formula. Other graphing and analysis must be manually completed each time data is collected.
Share
Crop specialists share static maps, weekly crop reports, risk-based threat alerts, and other outputs with growers using specialist blogs, email and print newsletters, and direct communication to help those growers manage pest & pathogen levels and respond to threats to increase crop yield and decrease the economic impact of these factors.
Pain Points
-
Manual Processes: Lots of communication, especially one-on-one communication, is redundant and costs specialists a lot of time.
-
Outdated or Incorrect Tools: Publishing tools available to specialists are fundamentally inadequate for the type and frequency of communication needed. This becomes especially apparent when data visualisations should be interactive or are time-sensitive as in the case of real-time threat alerts.
-
Policy: While specialists acknowledge the importance and value of regulatory requirements like french translation and AODA compliance they do not have the necessary support, tools, or resources to comply with regulations while also maintaining frequency and quality of communications.
Herbicide Resistance
Weed management specialists working with academic partners conduct trials to determine the efficacy and safety of different herbicides and weed management solutions. Specialists also record field observations in response to community reporting. Treatment efficacy scores are quantified and data is shared in a custom app available to growers.
View the Herbicide Resistance Data Lifecycle diagram
Store
Data is stored in ARM and Excel spreadsheets. Datasets may be emailed to the specialist to be imported into Excel or data must be manually entered. Data can be accessed through use of either platform or exporting data as a .csv.
Collect
Weed management specialists and academic partners set up controlled trials to assess the efficacy and safety (for crops) of various herbicides and weed management treatments. Trial crop, planting date, ground prep, treatment, efficacy of spray, and damage to crop are recorded along with other informal observations. Note taking is largely done with pen & paper and then manually entered into ARM or Excel. Photos are taken using mobile phones.
Field visits are also made in response to grower reports and occurrences of herbicide resistance and other observations are recorded informally.
Pain Points
-
Data Access: Access to historical trial data as well as historical weather data is a challenge for specialists and hinders the ability to identify trends over longer periods of time.
-
Outdated or Incorrect Tools: The ability to collect data in a standard and meaningful way is made difficult by a lack of sufficient reporting tools. From recording ad hoc observations with pen and paper to taking and storing photographs with personal mobile phones data becomes scattered and difficult to utilise.
-
Manual Processes: Digitizing analog notes, entering data into ARM or Excel, and aggregating reports and datasets are all examples of manual processes that limit specialist time available for analysis.
Analyse
Weed management specialists and GIS specialists assess occurences of herbicide resistance in the community and generate treatment efficacy scores from trial data. This analysis is done using Excel and ArcGIS to track the spread of herbicide resistance and determine the safety and effectiveness of treatments for weeds and crops.
Pain Points
-
Manual Processes: Manual cleaning and sorting of data reduces the time available for specialists to best analyse data effectively.
-
Outdated or Incorrect Tools: Standard software tools used by the academic community are 30-40 years old and do not generate human readable outputs. This makes the process of cleaning and manipulating the data necessary and is very time-consuming.
Share
Weed management specialists share raw data with stakeholders and publish herbicide efficacy data and recommendations using a custom Pest Manager app to minimise the economic impact of weeds and applying treatments for growers. The app is also used as an educational tool to allow growers to access and assess the latest data on a variety of treatments.
Pain Points
-
Lack of Resources: A lack of software development resources makes updating the app CMS or app software difficult which has an impact on the quality and usefulness of the data provided.
-
Manual Processes: Data must be manually entered into the app, which limits real-time data sharing and can be a convoluted process.
Insect Sightings
Insect sightings by members of the public are recorded by AICC staff and shared with entomologists to track important pests. This data is used to map spread of pest populations and identify high risk areas.
View the Insect Sightings Data Lifecycle Diagram
Store
Data is emailed to the entomologist and imported into Excel.
Collect
Insect sighting data is collected by AICC including the location (postal code) and a photo for confirmation. This data is shared with an entomologist to track occurrences of pests, their movement, and populations.
Data from external trap networks is also shared with specialists.
Pain Points
-
Data Access: Access to historical data is a challenge when trying to analyse long-term trends. The need to request up-to-date data collected by AICC can also pose challenges for specialists.
-
Data Standards: Consistency of collected data and quality of photos collected impacts the potential for meaningful analysis of the data.
-
Lack of Resources: A lack of project resources makes establishing a long-term trap network to support sighting data difficult despite the obvious benefits.
-
Outdated or Incorrect Tools: Tools used for the sharing of data impose their own challenges on the process. The seamless sharing of data and photos between AICC and specialists is crucial to the usability of the data.
-
Policy: Uncertainty around the needs and obligations in regards to PII can make specialists hesitant to collect it or share their data.
Analyse
OMAFRA entomologists and GIS specialists confirm sightings and map pest populations and movements using ArcGIS. Sightings are confirmed manually by reviewing photos emailed to the entomologist.
Pain Points
-
Lack of Resources: Lengthy processes and a lack of staff hours mean little analysis of the data can be performed by specialists.
-
Manual Processes: The process of confirming sightings takes up the bulk of this project as photos must be emailed individually and confirmed individually by the entomologist.
Fireblight Prediction
Crop and GIS specialists within OMAFRA collect weather data through an automated script and run the data through a prediction model for fireblight. This data is mapped and published so growers can respond to high risk conditions while deciding when to spray.
View the Fireblight Prediction Data Lifecycle Diagram
Store
Data is stored in Excel and ArcGIS. Data is saved automatically to Excel with a python script and manually entered into ArcGIS.
Collect
Weather forecast data is scraped from farmzone.com using a python script that is manually triggered by a GIS specialist. This data is saved by the script to an excel spreadsheet and added to the cougar blight prediction model.
Historical data must be manually copied and added to Excel, usually by a summer student.
Pain Points
-
Manual Processes: The python script that scrapes forecast data must be manually triggered to run and historical data must be manually copied and added to Excel. These manual processes limit the ability to provide real-time insights.
-
Outdated or Incorrect Tools: The python script was initially written by a summer student and is not easily maintained by any current staff. This means that when it runs into issues with current I&IT infrastructure or proxy errors it can be difficult to resolve.
Analyse
Forecast data is fed into a Cougar Blight Prediction Model set up in Excel to identify the highest risk areas for fireblight.
Pain Points
-
Data Access: Specialists currently have no way to track actual occurrences of fireblight in Ontario and therefore are unable to validate prediction models.
-
Manual Processes: Data scraped by the python script must be manually added to the prediction model which can slow down the process from forecast to risk assessment.
Share
GIS specialists create interactive maps of fireblight risk by region based on weather forecasts and publish them online using ArcGIS online and a gov.on.ca webpage. These maps allow growers to respond to immediate risks and ideally reduce sprays over a season.
Pain Points
-
Manual Processes: Tables of data representing fireblight risk based on weather forecasts grouped by region must be manually updated each time the map is updated to comply with AODA. Updating these tables manually can limit the number of times updates are made.
-
Outdated or Incorrect Tools: Maps displayed online have usability concerns and do not display on mobile in a useful way. This limits the impact and accessibility of the data.
-
Policy: The time required to comply with french translation policy limits the timeliness of communications that rely on short-term forecasting. This means that by the time publications are compliant the information they contain may no longer be relevant.
Field Crop Trials
Crop specialists run field trials with participating growers to measure the impacts of various treatments and techniques. Informal observations are recorded and key insights are shared in articles and at conferences.
View the Field Crop Trials Data Lifecycle Diagram
Store
Data is emailed to specialists, collected in-field, or collected using online services.
Collect
Crop specialists record ad-hoc notes in-field and view satellite imagery using online platforms to assess trial results. Participating growers email yield results generated by in-field machinery to specialists for analysis. Notes are often a mix of pen and paper and mobile phone photos. Yield data is primarily GIS shape files from precision ag machinery.
Pain Points
-
Data Access: While some historical data exists it is often lacking context and of little value to current analysis.
-
Data Standards: Data is generated in many different formats from a number of sources which makes aggregation of larger datasets difficult.
-
Lack of Resources: A lack of staff hours makes larger projects difficult, limiting the scope of data that can be collected. This limits the impact and longevity of projects.
-
Manual Processes: Data collected must be manually digitized, parsed, and entered into Excel which limits the time available for analysis.
-
Outdated or Incorrect Tools: The collection of in-field observations is often performed with pen and paper and photos are taken using mobile phones. These formats rely on email or photo libraries as filing systems and make retrieving data difficult. The data storage solutions available are also difficult to use and are fundamentally impermanent.
Analyse
Crop specialists conduct ad-hoc analysis to identify the effects of different treatments and strategies. Analysis is primarily done using Excel to compare data points and by visually comparing imagery.
Pain Points
- Lack of Resources: Computer resources available to specialists are often inadequate for the purposes of analysis, taking too long to boot up or open intensive programs. Because of this complex data types such as GIS shape files cannot easily be opened, let alone analysed. With data that is analysable crop specialists often lack the necessary skills to conduct in-depth data analysis and the resources to gain these skills are not available.
Share
Trial results and insights are shared at conferences and in meetings as well as through articles and informal conversations to improve the economic outcomes of growers.
Pain Points
- Policy: Complying with AODA and translation regulations is challenging for individual specialists and limits the amount of data they feel comfortable sharing.
AICC
AICC takes calls from members of the public who are either seeking information or reporting pest/event sightings, typically in response to information requests put out on local media. This data is collected and given to specialists for the purpose of analysis.
View the AICC Data Lifecycle Diagram
Store
AICC records data in Salesforce through manual entry. This data is exported as a .csv and emailed to specialists on request.
Collect
AICC reps receive pest sighting reports and record location (typically first three digits of postal code), a photo if possible, and other data as requested by specialists. Requests for reports are often made on local media when trying to track certain pests. Data is manually entered into a Salesforce CRM.
Pain Points
-
Lack of Resources: AICC is understaffed and can have trouble dealing with high call volumes.
-
Data Standards: Staff make judgement calls when collecting data about a pest or event that does not have specific criteria outlined by a specialist.
-
Manual Processes: Many manual processes within AICC could be automated with new technology. Following up with members of the public who have reported sightings is one key area that is difficult to maintain manually.
Share
AICC shares datasets with specialists on request or when in need of clarification or confirmation on a sighting. Data is exported from Salesforce and emailed to the relevant specialist.
Pain Points
-
Manual Processes: Data must be manually exported from Salesforce and shared with specialists on request.
-
Outdated or Incorrect Tools: Data is typically sent by email to specialists and specialists have no access to real-time data or automated notifications of updated data.
Simcoe Extension Office
Through informal conversation with staff from the Simcoe office a number of pain points were identified. Challenges largely fall into the categories of Weather Data, Grower Surveys, Publishing, and Pesticide Labels.
Weather Data
Specialists have lots of different sources for weather data but these sources have varying levels of quality and access. None of these sources provide specialists with easy access to real-time weather data or forecasts. These challenges make it difficult to identify long-term patterns of events.
Grower Surveys
Specialists have no access to a tool that would allow them to solicit feedback from growers or to broadcast requests for information.
Publishing
Specialists have a lot of difficulty publishing information online or in physical formats. Some older resources (eg. Specialty Cropportunities) can no longer be updated. Some of these challenges stem from a lack of resources to comply with publishing regulations such as french translation. These challenges ultimately result in an inability to publish real-time data and a large number of requests from growers for information that could easily be published in a single resource.
Pesticide Labels
Specialists need the ability to track changes in labels over time. This is made challenging by labels’ non-standard formats and the need to manually check labels for changes.