A Success Spectrum helps teams align expectations for the project and define success and failure in a concrete way on a spectrum instead of a binary pass/fail. This allows us to prioritize work clearly and create a roadmap for achieving success.

Facilitation
In this activity we asked participants to envision what success and failure might look like for our project as well as to identify potential criteria for those metrics.
We defined the spectrum in four sections.
- Failure (What are the criteria for failure and what might cause it)
- Minimum Viable Success (What are the minimum criteria for this to be successful)
- Target Success (If we work well and don’t hit any roadblocks what can we achieve)
- Epic Success (In a perfect world what would be the outcome)
This activity was facilitated in four parts:
-
(Solo Reflection) We asked participants to take some time and define what success for the project would look like for themselves at each of the levels outlined above.
-
(Group Discussion) Once everyone had written their thoughts down the groups were asked to discuss any overall trends and begin grouping their ideas by themes.
-
(Science Fair) After groups had had a chance to discuss amongst themselves we opened up the floor for participants to walk around the room and look at how other groups had approached the activity, taking the opportunity to share any insights their group had identified with members of other groups.
-
(Review) Finally participants were able to reconvene with their groups to discuss and apply anything they had learned from the other groups.
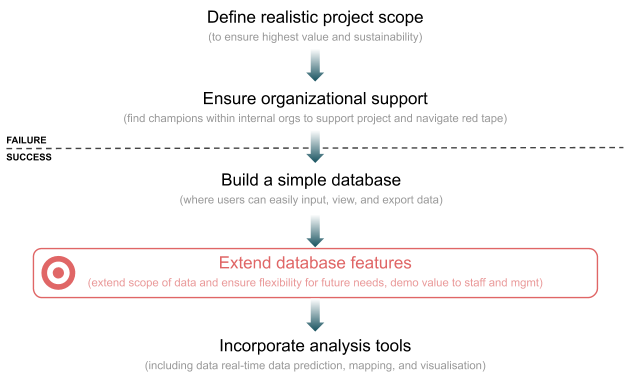
Group 1
Failure
Failure criteria largely fell into the categories of Planning, Red Tape, Buy-in, Scope, and Sustainability. Key failure scenarios identified included internal organizations blocking the project with red tape, a product solution being too tightly or too widely defined to be useful, and a product solution being prohibitive to maintain long-term.
Minimum
Minimum viability for success of the project was largely centered around a basic database solution. Other criteria identified included addressing data quality, staff accessibility, and a roadmap for future development.
Target
The target success criteria identified by participants again emphasised a database solution while also identifying staff and management buy-in as critical to this stage. Other criteria identified included simple analysis tools, product adaptability, and reporting tools.
Epic
Epic Success was almost entirely defined as complex and real-time analysis tools, including forecasting, mapping, and graphing components. Participants also identified a desire for external facing data features and an increased capacity for software development within OMAFRA as epic successes.
Roadmap

Group 2
Failure
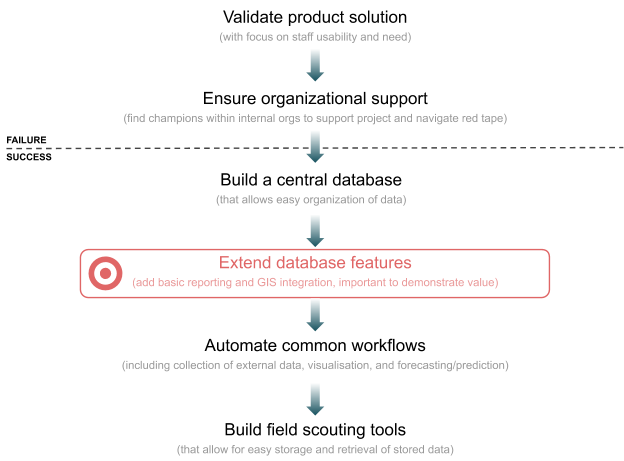
Participants in group 2 identified a lack of staff and senior management buy-in and building the wrong solution that was difficult to use as key scenarios for failure. Other criteria included poor sustainability and a poorly planned project approach.
Minimum
Similarly to group 1, minimum viable success was largely identified as a basic database that could standardize and organize data and be easily extended. Group 2 also identified some basic data collection and visualisation automation and early staff buy-in as minimum criteria.
Target
Target success was largely defined as organizational change where staff were eager to use a product solution and senior management actively supported the development and use of new tools. Target success criteria for a product included a data platform that would promote data sharing, automate basic tasks, integrate with existing workflows, and could be easily supported.
Epic
Criteria for epic success were spread over quite a few categories. The most prevalent themes identified an intuitive product that staff were excited to use, that helped in the collection of field data, and that helped improve workflow in other aspects of the ministry. Other criteria included automating entire data pipelines, improving access to critical datasets, and improving OMAFRA in house support for projects needs.
Roadmap

Group 3
Failure
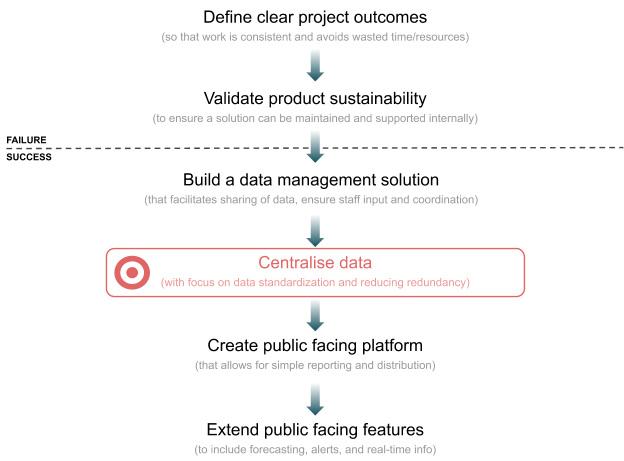
The primary scenarios this group identified for failure of the project were a product solution that could not be maintained or supported within the organization and a disjointed project approach that led to wasted time and money. Other criteria identified were insufficient data security and a loss of stakeholder buy-in.
Minimum
Criteria for minimum viable success identified by participants in group 3 centered around an internal data management solution that facilitated simple collaboration and data sharing. This would demonstrate value to stakeholders and gain staff buy-in.
Target
Target success was defined as a centralised data management solution with some public facing components for easy sharing of data with the public and features to improve standardization of data and internal collaboration.
Epic
Criteria for epic success outlined a centralised data platform with extensive public facing features including decision making tools, real-time information, forecasting models, and risk based alert systems.
Roadmap

Themes
Some themes emerged across our participant groups when we looked at the criteria identified for each level of the spectrum. This section will examine those themes in more detail.
Failure
Key failure scenarios identified across all three groups centered around a lack of sustainability for a product solution, a product solution that failed to address underlying challenges, and a lack of buy-in for the project from stakeholders and internal organizations.
-
Red Tape
Internal organizations within the ministry have a lot of opportunities to block the project if their support is not gained early on in the process. The project must seek support of these internal organizations and other stakeholders in order to navigate the red tape that exists in government.
-
Solution Scope
A product solution that does not address underlying challenges that staff face would result in wasted effort and resources. Some key scenarios that could lead to this include trying to include too many features, scoping the product too tightly to one use case, and building a solution that increases complexity of projects or is simply too difficult for staff to use.
-
Product Sustainability
Sustainability of a product solution is critical to its overall success. A product would be considered a failure if the cost to maintain the solution was prohibitive or if the system could not be supported by internal staff either due to a lack of training, technical skills, or infrastructure.
-
Stakeholder Buy-in
A critical point of failure identified for the project was centered around stakeholder behaviour. Crucial to long-term success is the buy-in of both front-line staff and upper management. For upper management the key failure scenario centered around a lack of support for the project. For front-line staff failure largely looked like a lack of engagement leading to a lack of use for any new product solution.
Minimum
Key criteria for minimum viable success were largely centered around a database solution that allowed for easy standardization and management of data. Minimum success also hinged on staff coordination and ease of access.
-
Data Management
A product solution as identified by every group had to include a simple and effective means of data management. Somewhere staff could store and easily access data that facilitated sharing and collaboration between staff and program areas.
-
Staff Buy-in
Engagement from staff came up across the board. At a minimum success level participants identified buy-in as an engagement from staff both in the product solution being developed but also in the process of planning and building it as well. Offering input was flagged as a critical criterion.
Target
Target success criteria identified a database product solution that centralised data, introduced some basic public facing components, and automated some simple workflows. This product must also be easily extendable to adapt to future needs.
-
Database
A database product solution outlined at this level of success included features that allowed sharing of basic data with the public, automated basic data visualisations and collection, and was easy for staff to access.
-
Sustainability
A product solution developed would also need to be easily adapted to future data needs to be considered as target success. This means that the data structures must be easy to update and that the product must be simple for future tech teams to interpret and improve.
Epic
Epic success for the project was defined broadly as an extension of the database product features and scope. Key features included automated analysis and visualisation workflows, a public facing dashboard, and real-time prediction capacity. Another key criterion was the internal capacity for software development at the ministry or branch level.
-
Automated Workflows
A key epic success criterion was the automation of complex data workflows. These were primarily scoped to analysis and visualisation of real-time data. Users of the platform would be able to easily define these workflows and as data was added to the database the outputs of these workflows would be automatically updated.
-
Public Data Portal
A critical part of the work users need to accomplish is the distribution of information. An epic outcome for this project would help solve that, giving users the ability to make data visualisations and other types of reports visible to an external audience.
-
Real-time Prediction
A particularly sticky aspect of the data analysis users may have to do is event forecasting and prediction. A product solution at the epic success level would allow for the automation of forecasting models with flexible outputs and parameters and the ability to send alerts to staff and/or the public when critical thresholds are met.
-
Internal Development Capacity
Separate from any product solution that may be developed for this project was the idea of capacity building. This was flagged as a critical marker of sustainability for the project. Fundamentally the solution outlined was the presence of an individual or team that could lead and coordinate software development and IT projects within ADB or the ministry.
Roadmap
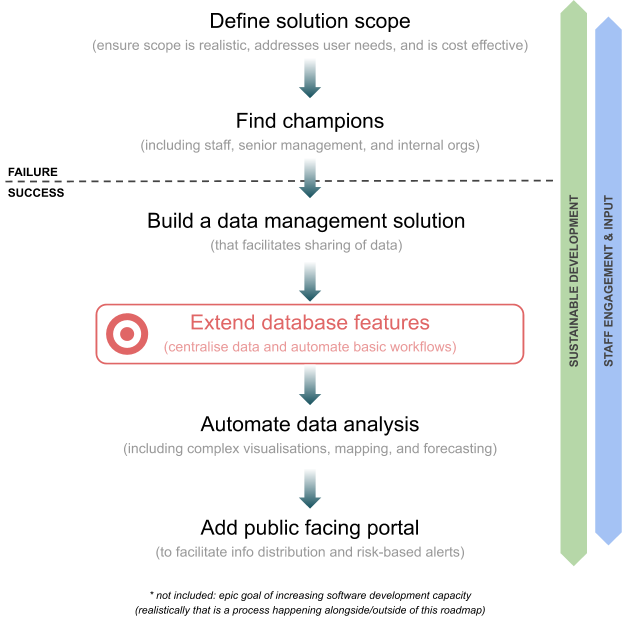
The themes identified above across participant groups give us a pretty good overview of what parts of the project are most important to its success. Using this analysis we can take a fairly informed first stab at a project roadmap as outlined by our participants’ expectations.

