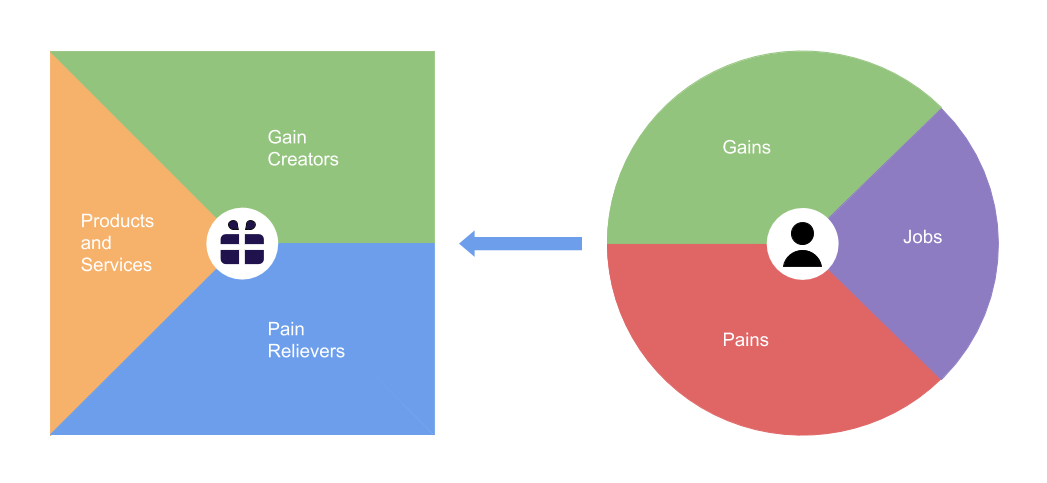
The Value Proposition Canvas is a tool which can help ensure that a product or service is positioned around what the customer values and needs.
Facilitation
In our activity we focused on the half of the value proposition canvas that identifies user Jobs, Gains, and Pains. This let us see how our team members and stakeholders conceptualized the work our users need to do, the impact that work has, and the challenges they face doing it.
To facilitate this we asked three questions:
- (Jobs) What does the user need to do?
- (Gains) Why is this important
- (Pains) What makes this hard?
Group 1
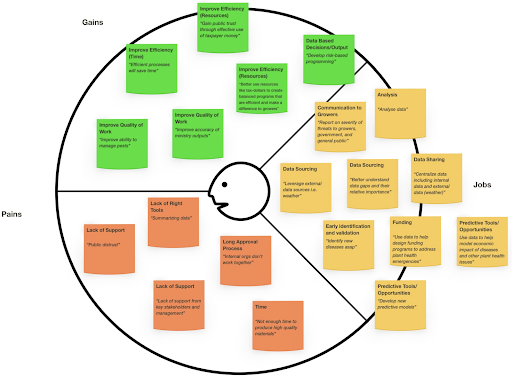
Jobs
Our user needs to interpret large amounts of data and use this data to inform recommendations, decisions, and priorities
Gains
If our user is able to make data-informed decisions they can clearly prioritize their time and resources which will lead to increased efficiency. This combined with a better access to crucial data will lead to a much higher quality of service.
Pains
Our user struggles with a lack of support and a lack of appropriate tools which means it takes too long to get anything done.
Group 2
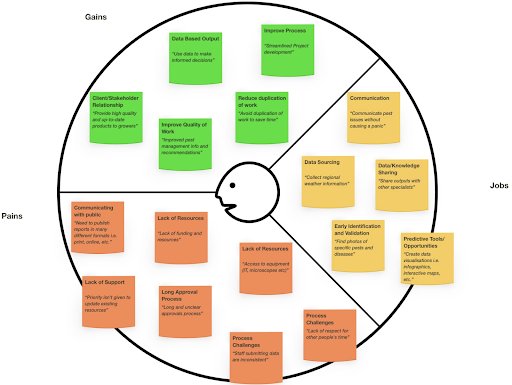
Jobs
Our user needs to collect data from external sources and share their analysis of this data with other specialists and growers.
Gains
By collecting this data our user can make informed decisions about their work. Data-sharing can save our user significant time, remove duplicate work within the team, and improve the quality of projects our user works on.
Pains
Our user struggles with a lack of funding, support, and equipment that hurts their ability to communicate internally and with the public. Unclear internal communication also makes their work more challenging.
Group 3
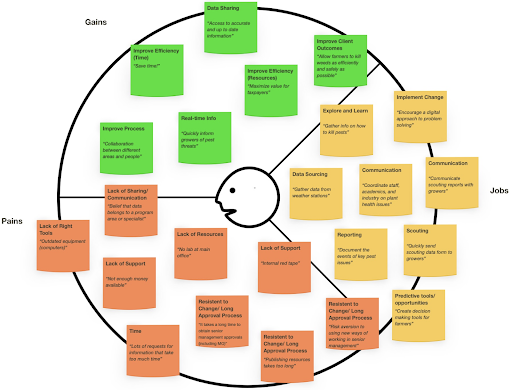
Jobs
Our user needs to gather and document data, coordinate staff to streamline their project, and share data and tools with growers.
Gains
Better access to information and expertise saves our user time and adds value to taxpayers and growers.
Pains
Our user struggles with a lack of appropriate tools, a lack of support, and unclear communications which leads to an inefficient use of time. Organizational risk aversion and resistance to change also impacts our users ability to do their work. Lastly, they struggle with the belief that data belongs to a person or program area which impacts their access to data necessary to do their work.
Themes
A few themes emerged when we looked at all of the Value Proposition Canvases completed by our participants. This section will highlight the overarching themes identified by all or most of our participants.
Jobs
The vast majority of jobs performed by our users involve the collection, documentation, analysis, and sharing of data.
Data Collection
The ability to collect large amounts of data is a key component of our users’ work and was identified across the three groups who participated in the Value Proposition activity. This task was broadly identified as two sub-categories: Aggregation from external sources, and Documentation of novel data generated by users and their partners.
Weather Data
One of the key data types identified was weather data. This involves both the aggregation of external sources (The Weather Network’s Farmzone, Environment Canada weather stations, etc.) and internal documentation by multiple groups that run and maintain their own weather stations. Users must spend large amounts of time pulling information from these disparate sources for analysis and prediction.
Data Sharing
Our users must find ways to share data and their analysis with two primary groups: Other internal users doing similar work, and Growers who use the data to inform decisions they make.
Data Based Decision Making
Our users make a lot of decisions every day around how to prioritize work, when to make recommendations to stakeholders and growers, and what those recommendations should be. The ability to use data to inform these decisions is crucial.
Gains
Our users’ motivations revolve around being able to do work efficiently and to a high standard of quality, ultimately prioritizing the value they add to taxpayers and the growers they work with.
Efficiency
One of the key gains identified across our participant groups was efficiency of time and resources. Our participants saw this happening in many ways including through better access to information and skill sharing, data sharing between teams to reduce duplicate work, and being able to make decisions based on data. Although expressed in many ways this idea of using time efficiently was a key driver identified for our users.
Data Sharing
The ability to share data internally was integral to our users’ motivations. Being able to build on work other users have already done and quickly reference data from other teams and projects was identified as a key part of producing high quality and relevant work.
Data Based Decision Making
Using data to make quicker and better decisions was a common theme across participant groups. Being able to target work based on risk and greatest need is an important motivation for our users. Along with this is the ability to ensure that legislation and funding respond to need over political will.
Taxpayer Value
Our participants identified taxpayer value as one of the gains the users focus on to inform their work. Both by maximizing the impact and value of taxpayer dollars as well as ensuring that the work they do has the greatest benefit to taxpayers, including growers.
Pains
Users’ pains revolve around a lack of resources and organizational support as well as unclear internal communication. Whether a lack of funding, up-to-date equipment, appropriate workspaces, or digital tools this lack of resources causes friction that impacts our users and the quality of their work.
Lack of Support
Our users feel that there is a lack of support from key stakeholders including senior management, internal organizations, as well as the public. This means that users aren’t able to navigate the bureaucracy of government effectively and important work becomes blocked or stalled.
Lack of Resources
Access to lab space and equipment, working computers, digital software and tools, and project funding were just some of the resource limitations identified as causing friction for users. This was identified by participants as negatively impacting the users’ quality of work and productivity.
Unclear Communications
Users experience inconsistent and unclear internal communications which require time to interpret and address and can stall progress on a user’s project altogether until addressed. It’s important to note that this internal communication can also include process documentation as well as more traditional communication such as email, phone, and in-person.