Defining Success with Sprint Zero
On February 14th we had the opportunity to run a Sprint Zero meeting with a large group of OMAFRA staff. We gathered about 30 people in one of the conference rooms at 1 Stone rd. and spent the next three hours persuading our government partners to write their thoughts down on a mountain of sticky notes.
“I usually don’t like anything with sticky notes but this was not a complete waste of my time”
Read the full Sprint Zero Summary document
- What is a sprint and what is a Sprint Zero?
- Goals of our meeting
- Value Proposition Canvas
- Success Spectrum
- Roadmap
- Conclusion
What is a sprint and what is a Sprint Zero?
Most of the technology sector owes its success to the focus put on how we work. By making sure that we are always working on what is most important and quickly adapting our priorities we can be sure that whatever we are working on is adding the most value to our project and our users.
A sprint is a short period of time planned to complete a set amount of work.
A Sprint Zero kicks off a project. We used Sprint Zero to define success, identify obstacles, and align the expectations of our team of stakeholders. It is typically run at the start of a project, involves a lot of sticky notes, and when run well ensures that we’re all on the same page moving forward.
Goals of our meeting
We had four stated goals in our Sprint Zero meeting:
- Engage the team in the process
- Build a better understanding of the project scope
- Define success (and failure)
- Discover the team’s rhythm
From this we were looking to achieve two outcomes:
- Align our stakeholders’ expectations
- Build a better understanding of their needs
To achieve this we ran two activities adapted from workshops run by Matt Thompson for our Code for Canada fellowship cohort during onboarding.
Value Proposition Canvas
The Value Proposition Canvas is a tool which can help ensure that a product or service is positioned around what the customer values and needs.
Read the full Value Proposition Analysis
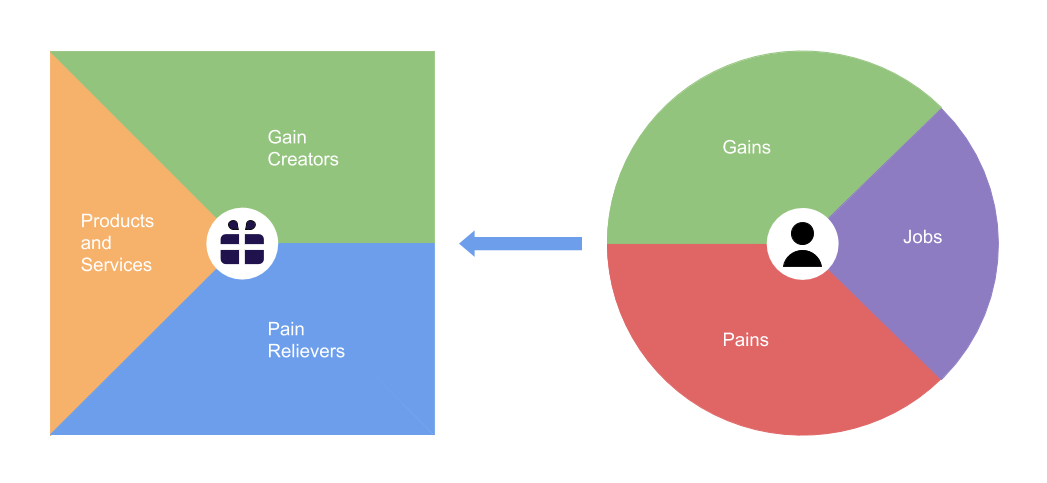
We asked our participants three questions about our users:
- (Jobs) What does the user need to do?
- (Gains) Why is this important?
- (Pains) What makes this hard?
Through this we learned a few things.
- Our users’ jobs focus on data analysis and collection
- They are motivated by adding value to taxpayers and the growers
- Users struggle with a lack of resources and support
Success Spectrum
A Success Spectrum helps teams align expectations for the project and define success, allowing the team to prioritize work and create a roadmap for achieving success.
Read the full Success Spectrum Analysis
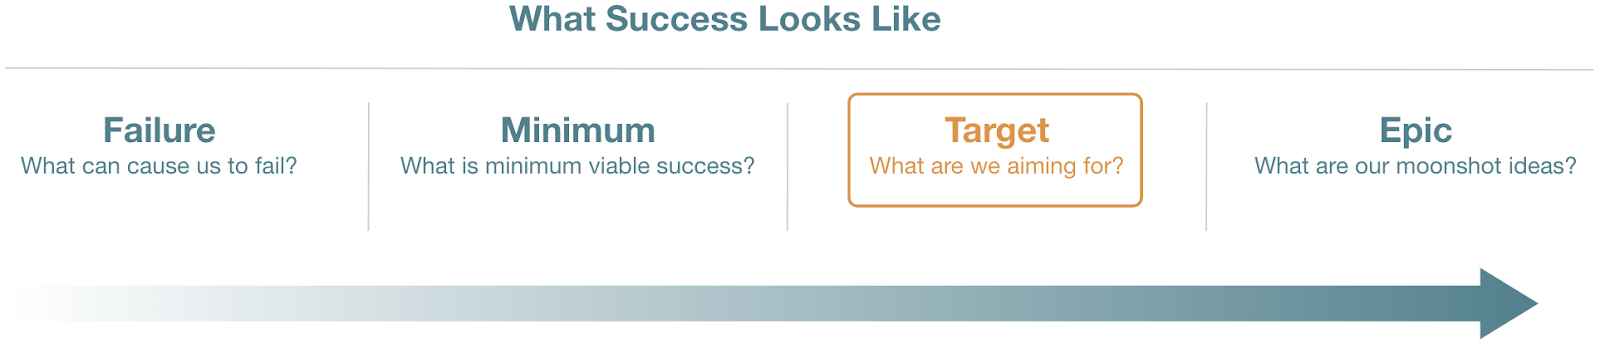
In this activity participants were asked to envision what success and failure might look like for the project and to list criteria for each stage.
A few themes were identified in our participants responses to this activity:
This project would fail if:
- A solution wasn’t sustainable
- A solution did not address underlying challenges
- Stakeholders and internal organizations didn’t support the project
The project could only be called a success if:
- We improved data management and standardization
- A solution was easy to access
- Staff were engaged in the process and offered input
The target goal for the project is a central database that:
- Allows sharing of data
- Automates simple workflows
- Is easy to adapt and maintain for future data needs
In a perfect world the solution would:
- Automate complex data analysis and visualisation
- Include a public data portal
- Provide powerful forecasting tools to predict threats and measure risk
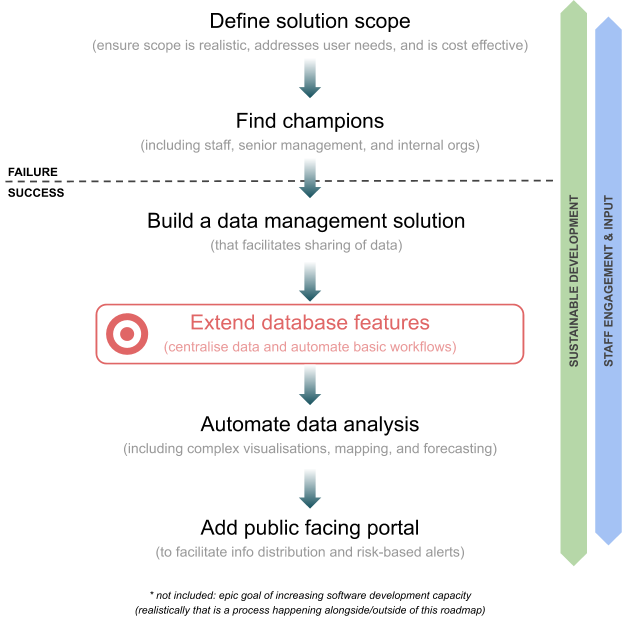
One last epic success that participants identified was building internal capacity within OMAFRA for software development. This would dramatically increase the sustainability of this project and all I&IT projects within the ministry.
Roadmap
From these themes we were able to draw a roadmap for success that follows the path outlined by our stakeholder participants.
Conclusion
We set out to align the expectations of our stakeholder participants and to better understand their needs. We achieved these goals by facilitating reflection and discussion among our stakeholder participants and we’re excited to continue facilitating communication throughout our fellowship.
We now have a much better understanding of the needs and expectations of our stakeholders. We have a Success Spectrum and a Value Proposition Canvas defined by our participants and we have a clear roadmap that we can use to guide our work. This will let us prioritize the project to make sure we’re always working on what is most important.
I think it’s safe to say that this Sprint Zero meeting was an Epic Success.