On February 14th we had the opportunity to run a Sprint Zero meeting with a large group of OMAFRA staff. The goal of our Sprint Zero was to align the expectations of a large team of stakeholders. We approached this by giving an overview of our process and running two activities designed to help the participants define the value this project will bring and identify criteria for success.
- Meeting Outline
- Executive Summary
- Code for Canada @ OMAFRA
- Sprint Zero Introduction
- Activities
- Conclusion
Meeting Outline
- Code for Canada @ OMAFRA presentation
- Sprint Zero introduction
- Value Proposition Activity
- Success Spectrum Activity
Executive Summary
The goals of our Sprint Zero meeting were to align the expectations of our large team of stakeholders and better understand those expectations and the needs of our participants. We approached this by giving an overview of our team and process and running two activities designed to help the participants define the value this project will bring and identify criteria for success.
The stakeholder team participated in a Value Proposition Canvas, which is designed to align a product or service solution around the needs of the user. Participants identified users’ Jobs, Gains, and Pains through solo reflection and group discussion. This workshop allowed the team to develop an in-depth understanding of the scope of data regularly accessed by users and their motivations in interactions with end-user clients. Pains that were identified by this stakeholder group were a lack of resources and support.
In addition, the stakeholder team identified the criteria involved in determining a Success Spectrum for the project. This process aligns stakeholders’ expectations and defines success on a spectrum from failure to epic success.
Outcomes of this process include a roadmap for success which emphasises planning, relationship building, and product development as key contributors to success. This also allowed our team to identify that important action items for the process were enabling sustainability and staff engagement at every stage.
The results of this meeting will allow the Code for Canada team to effectively prioritize and execute work on this project.
Code for Canada @ OMAFRA
Code for Canada is a national nonprofit that connects government innovators with the tech and design community. Our programs enable governments to deliver better digital public services and empower communities to solve civic challenges using technology and design.
Code for Canada Programs
Read about Code for Canada on our about page or at codefor.ca
Our Team
We also discussed the fellowship team at OMAFRA
How We Work
The cornerstone of our approach is the concept of agile work. Our interpretation of agile allows teams to respond to challenges faster and adapt their work to a rapidly changing environment.
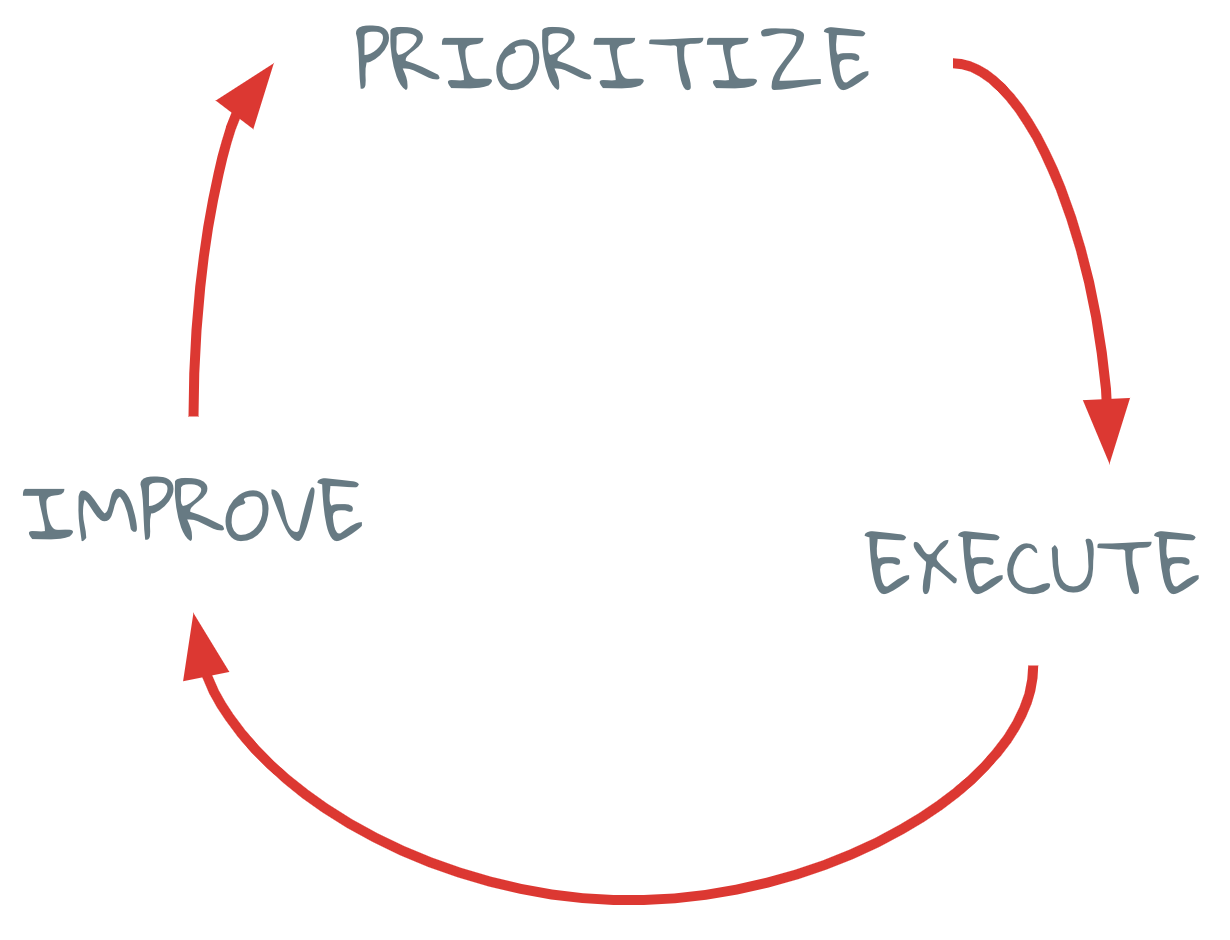
Plan the Thing, Do the Thing, Make it Better.
Or more simply: Prioritize, Execute, Improve.
By working in short intervals of time and following these three steps teams can be sure that they are always working on the most important work at any given time and that as priorities change they can quickly adapt their approach.
The Process
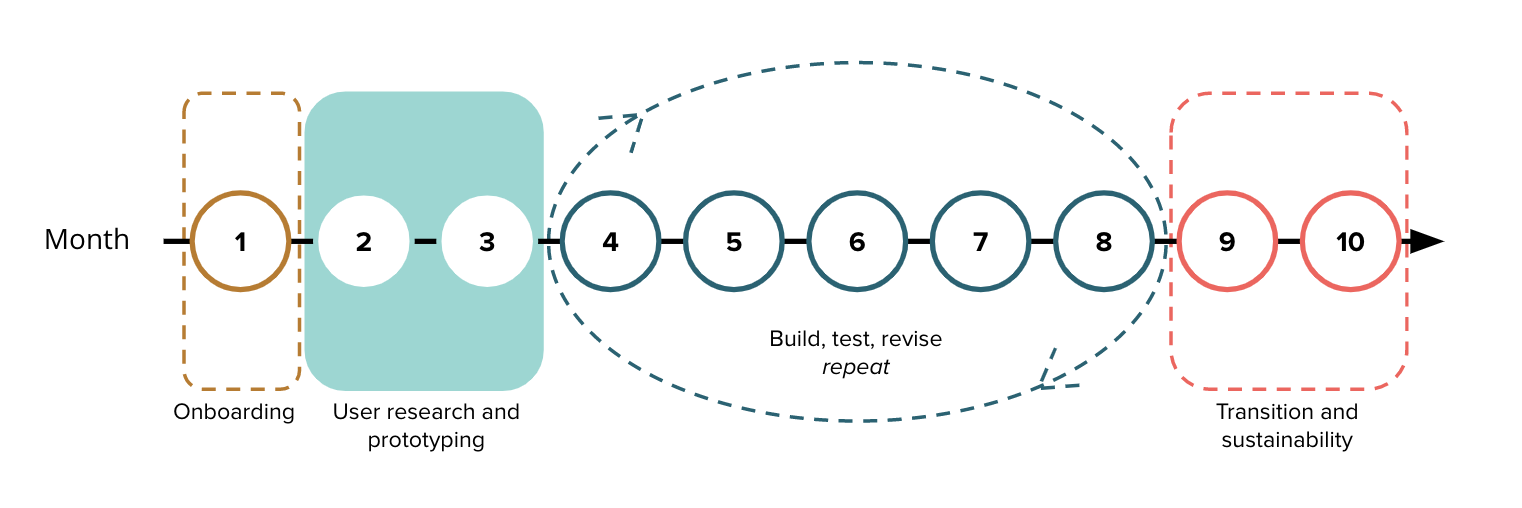
The fellowship project is divided into four phases. These phases and timelines are always flexible and may change as we learn more about the needs of the team, the challenge scope, and the ministry as an organization.
-
Onboarding - Month 1
The first month of the project is located in Toronto at the Code for Canada offices with other fellowship teams participating in facilitated workshops designed to prepare the fellows for working with government partners and provide the tools needed to solve a diverse set of unique challenges.
-
User Research and Prototyping - Months 2 and 3
The following two months are focused on research. This includes technical research, a jurisdiction scan, and organizational research as well as a focus on user research. Over this phase fellows will conduct interviews with crop protection specialists, growers, and industry professionals to identify key pain points and potential avenues for a solution.
-
Build, Test, Revise, Repeat - Months 4 through 8
The longest phase consists of designing, building, and testing solutions to the problems identified in user research. Fellows will begin by designing and testing a number of different concepts, using the feedback from this testing to improve on successful ideas and solidify the core approach. The goal for this phase is to have a clearly defined product that has been tested and is ready for maintenance and extension work as needed.
-
Transition and Sustainability - Months 9 and 10
These core principles will inform the project at every stage, and will receive a high priority as this iteration of the project nears its end. This phase will focus on documentation of the product and processes developed during the project as well as preparation for OMAFRA staff for a smooth project handoff. Work during this time will be to ensure that the project owners going forward have the tools, skill sets, and support necessary for the long-term success of the project.
Sprint Zero Introduction
What is a Sprint
A sprint is a short period of time planned to complete a set amount of work
Most of the technology sector owes its success to the focus put on how we work. By ensuring that our work processes are enabling us to focus on what’s most important we can remove many blockers that inefficient processes can introduce.
The core principle at the heart of most modern work methodologies is the sprint (or an equivalent concept). A sprint is a short iteration of work that helps us prioritize the tasks that must be done by setting a concrete goal and executing on it. Teams then take learnings from the sprint forward to help plan the next sprint, repeated until the end of the project.
A sprint can be visualized as four steps: Sprint Planning where the team sets the goal and plans specific tasks, Daily Work with check-ins to make sure everything’s on track and no one is blocked, Sprint Review where the team demos the work done (either for stakeholders or just internally), and Sprint Retro where the team identifies successes and failures of the sprint and uses them to identify a few key action items to help improve their work and project.
What is a Sprint Zero
Sprint Zero kicks off a project. Our version of Sprint Zero is used to define success, identify obstacles, and align the expectations of our team and stakeholders. It is typically run before the start of a project, involves a lot of sticky notes, and when run well ensures that we’re all on the same page moving forward.
Our intention is to engage the team and stakeholders in the process, build a better understanding of the project scope, define success and failure, and discover our team’s rhythm.
Activities
Participants were split into three groups for both activities. Each activity involved a period of solo-reflection for the participants to get their ideas written down followed by a discussion where each group had the opportunity to identify overarching themes that emerged and discuss the ideas their fellow group members had identified. Finally the groups had the opportunity to walk around the room and discuss the work the other groups had done.
Value Proposition Canvas
The Value Proposition Canvas is a tool which can help ensure that a product or service is positioned around what the customer values and needs.
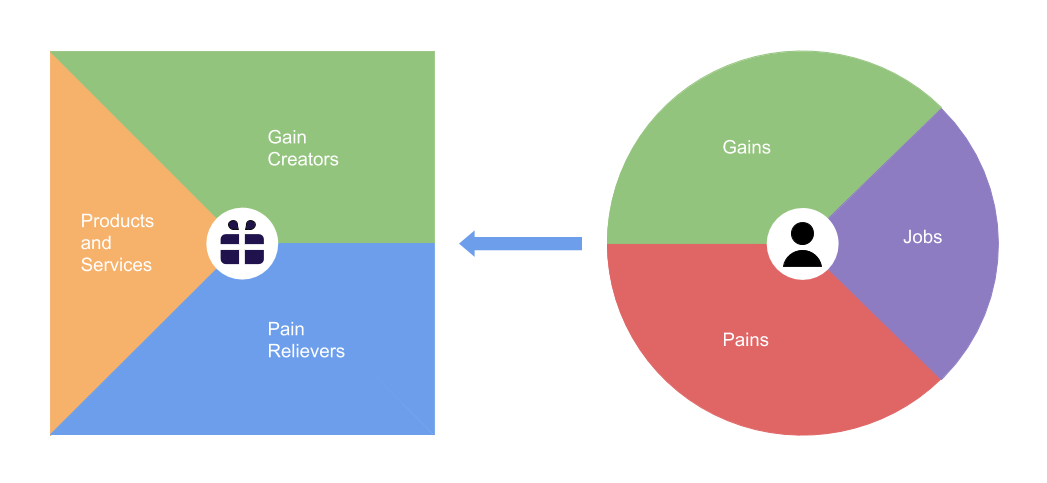
In this activity participants were asked to complete the half of the value proposition canvas that identifies user Jobs, Gains, and Pains. This let us see how stakeholder participants conceptualized the work users need to do, the impact that work has, and the challenges that are faced when doing it.
To facilitate this we asked three questions:
- (Jobs) What does the user need to do?
- (Gains) Why is this important?
- (Pains) What makes this hard?
Key Themes
For a more in depth analysis of this activity you can read the full document here.
Jobs
The vast majority of jobs performed by our users involve the collection, documentation, analysis, and sharing of data.
- Data Collection
- Weather Data
- Data Sharing
- Data Based Decision Making
Gains
Our users’ motivations revolve around being able to do work efficiently and to a high standard of quality, ultimately prioritizing the value they add to taxpayers and the growers they work with.
- Efficiency
- Data Sharing
- Data Based Decision Making
- Taxpayer Value
Pains
Users’ pains revolve around a lack of resources and organizational support as well as unclear internal communication.
- Lack of Support
- Lack of Resources
- Unclear Communications
Success Spectrum
A Success Spectrum helps teams align expectations for the project and define success and failure in a concrete way on a spectrum instead of a binary pass/fail. This allows us to prioritize work clearly and create a roadmap for achieving success.
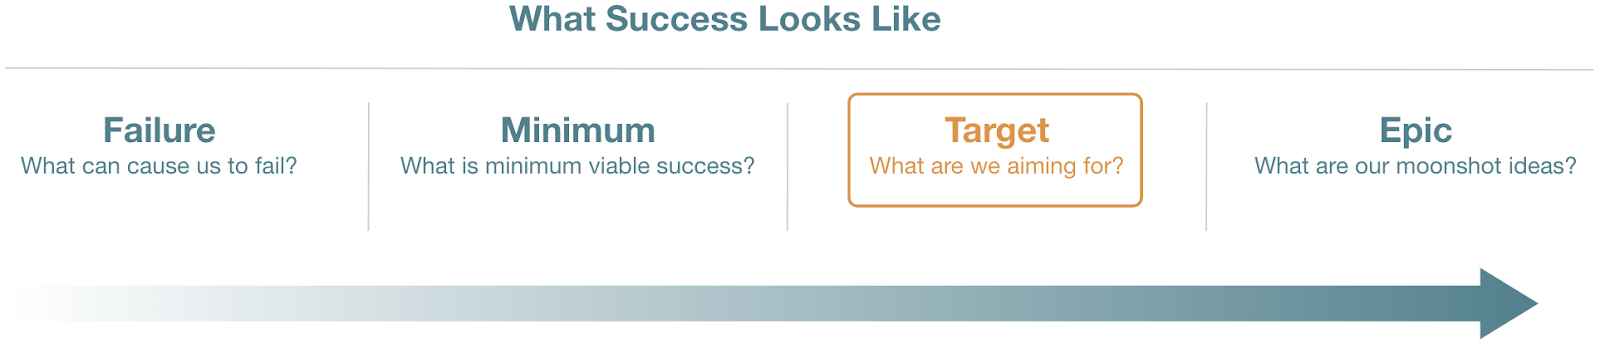
In this activity participants were asked to envision what success and failure might look like for the project as well as to identify potential criteria for those metrics.
Key Themes
For a more in depth analysis of this activity you can read the full document here.
Failure
What are the criteria for failure and what might cause it?
Key failure scenarios identified across all three groups centered around a lack of sustainability for a product solution, a product solution that failed to address underlying challenges, and a lack of buy-in for the project from stakeholders and internal organizations.
-
Red Tape
Internal organizations within the ministry have a lot of opportunities to block the project if their support is not gained early on in the process. The project must seek support of these internal organizations and other stakeholders in order to navigate the red tape that exists in government.
-
Solution Scope
A product solution that does not address underlying challenges that staff face would result in wasted effort and resources. Some key scenarios that could lead to this include trying to include too many features, scoping the product too tightly to one use case, and building a solution that increases complexity of projects or is simply too difficult for staff to use.
-
Product Sustainability
Sustainability of a product solution is critical to its overall success. A product would be considered a failure if the cost to maintain the solution was prohibitive or if the system could not be supported by internal staff either due to a lack of training, technical skills, or infrastructure.
-
Stakeholder Buy-in
A critical point of failure identified for the project was centered around stakeholder behaviour. Crucial to long-term success is the buy-in of both front-line staff and upper management. For upper management the key failure scenario centered around a lack of support for the project. For front-line staff failure largely looked like a lack of engagement leading to a lack of use for any new product solution.
Minimum Viable Success
What are the minimum criteria for this to be successful?
Key criteria for minimum viable success were largely centered around a database solution that allowed for easy standardization and management of data. Minimum success also hinged on staff coordination and ease of access.
-
Data Management
A product solution as identified by every group had to include a simple and effective means of data management. Somewhere staff could store and easily access data that facilitated sharing and collaboration between staff and program areas.
-
Staff Buy-in
Engagement from staff came up across the board. At a minimum success level participants identified buy-in as an engagement from staff both in the product solution being developed but also in the process of planning and building it as well. Offering input was flagged as a critical criterion.
Target Success
If we work well and don’t hit any roadblocks what can we achieve?
Target success criteria identified a database product solution that centralised data, introduced some basic public facing components, and automated some simple workflows. This product must also be easily extendable to adapt to future needs.
-
Database
A database product solution outlined at this level of success included features that allowed sharing of basic data with the public, automated basic data visualisations and collection, and was easy for staff to access.
-
Sustainability
A product solution developed would also need to be easily adapted to future data needs to be considered as target success. This means that the data structures must be easy to update and that the product must be simple for future tech teams to interpret and improve.
Epic Success
In a perfect world what would be the outcome?
Epic success for the project was defined broadly as an extension of the database product features and scope. Key features included automated analysis and visualisation workflows, a public facing dashboard, and real-time prediction capacity. Another key criterion was the internal capacity for software development at the ministry or branch level.
-
Automated Workflows
A key epic success criterion was the automation of complex data workflows. These were primarily scoped to analysis and visualisation of real-time data. Users of the platform would be able to easily define these workflows and as data was added to the database the outputs of these workflows would be automatically updated.
-
Public Data Portal
A critical part of the work users need to accomplish is the distribution of information. An epic outcome for this project would help solve that, giving users the ability to make data visualisations and other types of reports visible to an external audience.
-
Real-time Prediction
A particularly sticky aspect of the data analysis users may have to do is event forecasting and prediction. A product solution at the epic success level would allow for the automation of forecasting models with flexible outputs and parameters and the ability to send alerts to staff and/or the public when critical thresholds are met.
-
Internal Development Capacity
Separate from any product solution that may be developed for this project was the idea of capacity building. This was flagged as a critical marker of sustainability for the project. Fundamentally the solution outlined was the presence of an individual or team that could lead and coordinate software development and IT projects within ADB or the ministry.
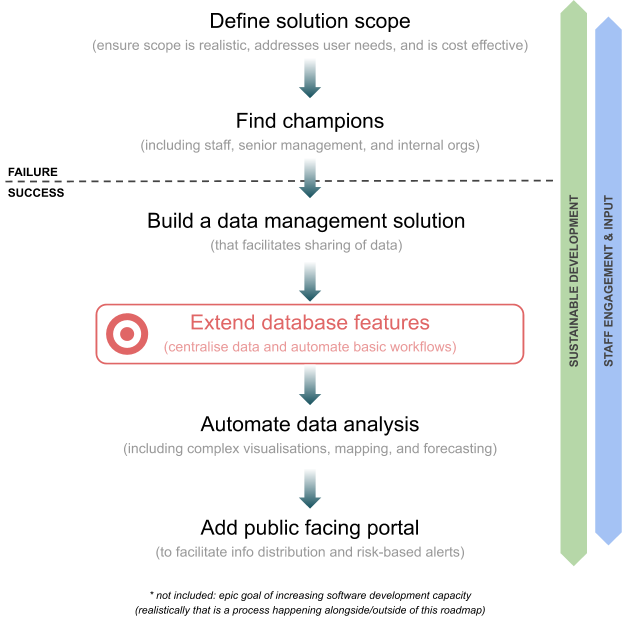
Roadmap
Okay, what does this look like?
The themes identified above across participant groups give us a pretty good overview of what parts of the project are most important to its success. Using this analysis we can take a fairly informed first stab at a project roadmap as outlined by our participants’ expectations.
Conclusion
The Value Proposition Canvas the stakeholder participants created outlines the data collection, analysis, and distribution required in the participants wor so as to provide the highest possible value to taxpayers and growers. Challenges in completing this work were identified as a lack of resources and support from management.
The stakeholder participants also defined a project Success Spectrum that identified key success criteria as project sustainability, staff engagement, a clear project scope, and a data management solution.
The stated goals of this Sprint Zero were to align and understand the needs and expectations of a large team of stakeholders. Both were accomplished by facilitating reflection and discussion among our stakeholder participants.
The outcome of this Sprint Zero meeting is a roadmap for the success of this project informed by the motivations of the stakeholder participants. This will allow the Code for Canada fellowship team to effectively prioritize and execute work on the project.